Your labs, decoded.
Upload your lab report PDF. RangeTrue extracts every biomarker, scores each one against evidence-based optimal ranges — not just lab normals — and generates a root-cause analysis of what's driving every result that isn't where it should be.
Most people with "normal" labs are nowhere near optimal. RangeTrue shows you the difference — biomarker by biomarker, with a composite health score from 300 to 1,000 and cited guidance on what to do about it.
“Normal” doesn't mean optimal.
Lab reference ranges are built from population averages — they tell you whether you're outside the bottom 2.5% or top 2.5% of people who got tested at that lab. That's it. They say nothing about whether your levels are where they need to be for your body to perform, recover, and stay disease-free.
Functional medicine, longevity research, and sports science have produced decades of evidence on what biomarker values are actually associated with optimal metabolic function, hormonal balance, cardiovascular health, and cognitive performance. None of that shows up on your standard lab printout.
RangeTrue closes that gap — for every biomarker on your report, we score it against those evidence-based optimal targets and explain exactly what's driving a result that doesn't hit the mark.
Optimal TSH for metabolic efficiency is 1.0 – 2.0 mIU/L. Levels above 2.5 are associated with reduced T4→T3 conversion and early subclinical hypothyroidism. See root-cause analysis.
Optimal 25-OH Vitamin D for immune, hormonal, and bone function is 50–80 ng/mL. At 31 ng/mL you are functionally deficient despite being “normal.” See root-cause analysis.
What a finished analysis looks like
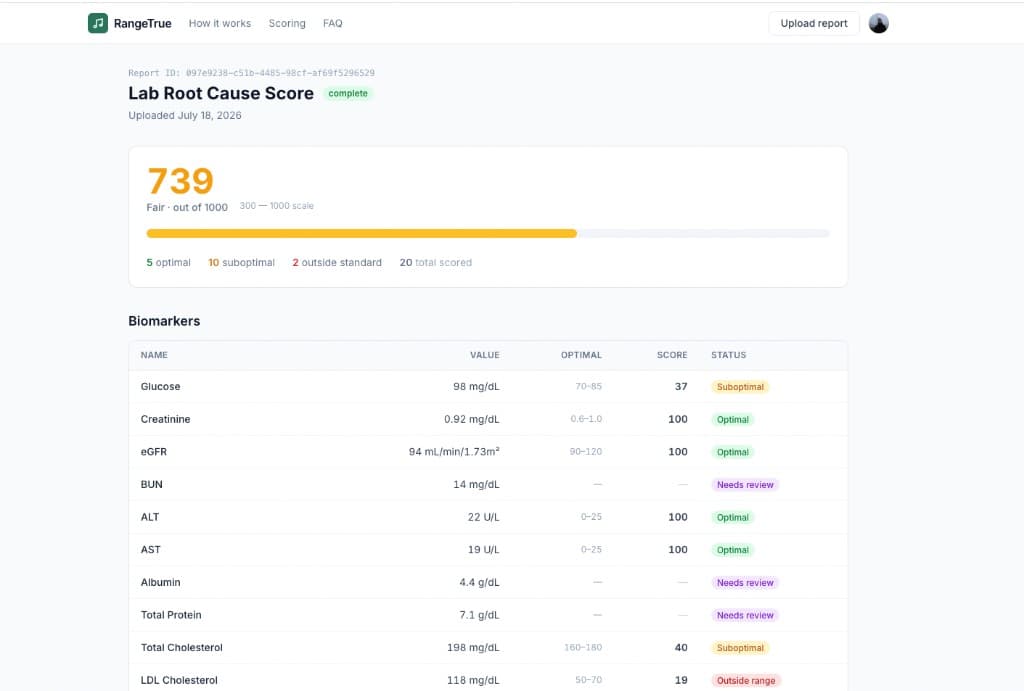
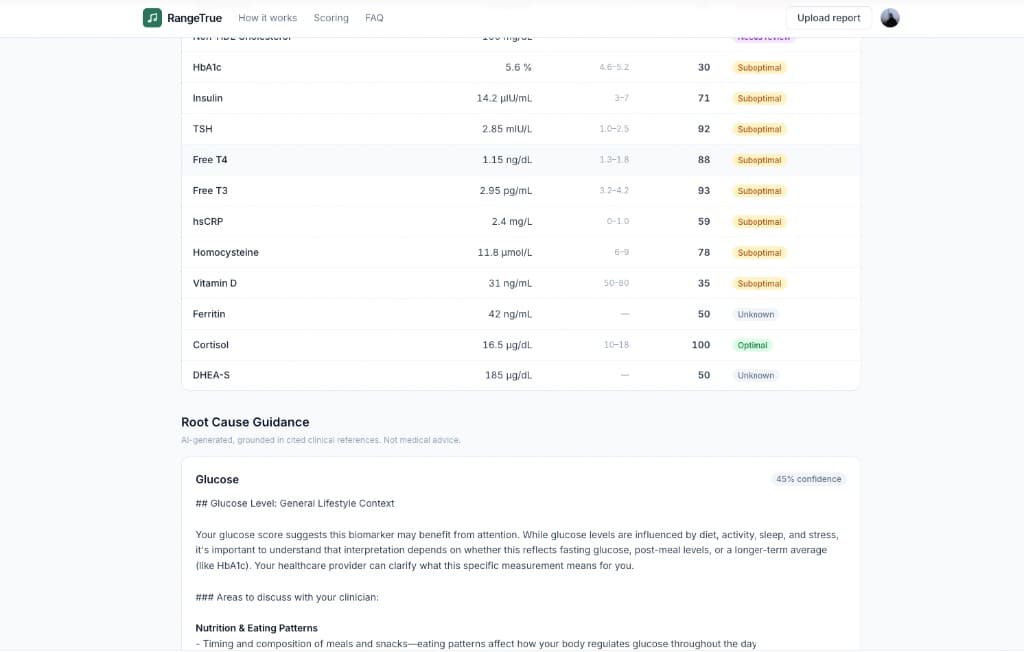
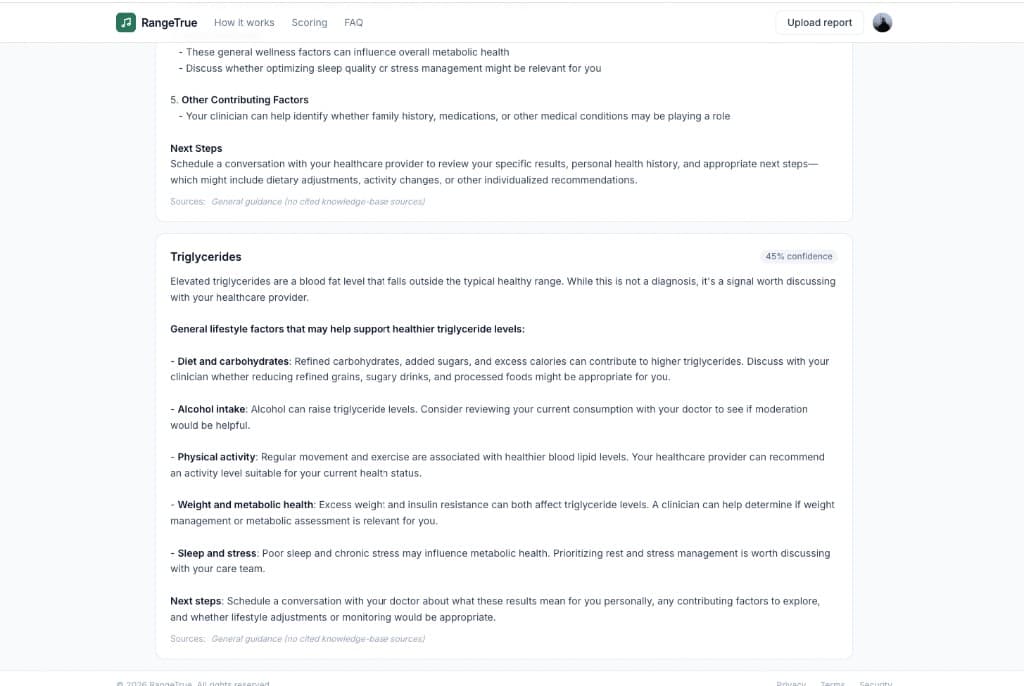
Composite score, every biomarker against optimal ranges, and root-cause guidance for what needs attention — the same view you get after upload.
First report free · PDF from Quest, LabCorp, hospital labs, and more
From PDF to root-cause analysis in under a minute
Upload your lab report PDF
Drag and drop or click to upload any standard lab report PDF — Quest Diagnostics, LabCorp, hospital labs, concierge panels, or direct-to-consumer tests. Your file is encrypted in transit and at rest. We never store your report in plaintext or use it for advertising.
Supported formats: PDF. Compatible with any standard US or international lab printout. Processing begins immediately after upload.
- Works with Quest, LabCorp, hospital labs, and more
- Encrypted at rest with AES-256
- Never logged, never used for advertising
- No account or login required to get started
Biomarker extraction & optimal-range scoring
Our pipeline reads your PDF, identifies every biomarker by name and unit, normalizes it to canonical form, and scores it against a curated optimal-range database drawn from functional medicine literature, longevity research, and sports science. Each biomarker gets an individual score from 300 to 1,000.
A composite score is calculated as a weighted average across all biomarkers. Scores below 650 are flagged for root-cause analysis.
- Extracts all standard metabolic, hormonal, and hematologic markers
- Scores against optimal targets — not population averages
- Composite score 300–1,000 with category breakdowns
- Results ready in 30–60 seconds
Root-cause AI guidance for every flagged result
For every biomarker outside optimal range, RangeTrue's AI generates a structured root-cause analysis: the most likely physiological and lifestyle drivers behind that specific result, what to discuss with your doctor, and what the evidence says about moving it toward optimal. All guidance is grounded in cited sources.
Guidance is informational and does not constitute medical advice. Always discuss changes with your healthcare provider.
- Root-cause drivers ranked by likelihood for each biomarker
- Evidence-based interventions with source citations
- Plain-language explanations alongside clinical detail
- Shareable report link for your doctor or health coach
One number that tells you where you actually stand
Every biomarker on your report receives an individual score from 300 to 1,000 based on how close it sits to the evidence-based optimal range — not just inside or outside the lab's population reference interval.
Those individual scores are aggregated into a single composite score, weighted by clinical significance. Hormonal markers and metabolic indicators carry more weight than minor vitamin levels. The result is a single number that meaningfully reflects the state of your metabolic and physiological health — not just whether you avoided a lab flag.
Your score comes with a category breakdown — metabolic, cardiovascular, hormonal, inflammatory, and nutritional panels — so you can see where the issues are clustered, not just what the aggregate says.
Get my scoreAll or nearly all biomarkers in optimal range. Strong metabolic, hormonal, and cardiovascular function indicators.
Most biomarkers in or near optimal range. A few areas worth monitoring or mild lifestyle adjustments.
Multiple biomarkers outside optimal range. Suboptimal function in one or more systems. Root-cause analysis recommended.
Significant deviation from optimal targets. Several biomarkers may be driving symptoms or elevated long-term risk.
Multiple critical biomarkers outside optimal range. Prompt discussion with a healthcare provider is advised.
First report free. Credits when you need more.
Every plan includes the full pipeline — extraction, optimal-range scoring, and personalized root-cause guidance. Buy credits once; use them anytime.
Free
1 report
Try the full analysis once — score, biomarkers, and guidance included.
- 1 complete lab analysis
- Composite score (300–1,000)
- Biomarker table + status
- Root-cause guidance
Starter
2 reports
$6 / report
A couple of follow-ups after your free analysis — credits never expire.
- 2 report credits
- Everything in Free
- Shareable doctor link
- Credits never expire
Plus
8 reports
$4.88 / report
Best for quarterly retests and tracking progress over the year.
- 8 report credits
- Everything in Starter
- Priority processing
- Credits never expire
Pro
20 reports
$3.95 / report
For households, coaches, or anyone analyzing labs often.
- 20 report credits
- Everything in Plus
- Priority processing
- Credits never expire
Report credits are one-time purchases and do not auto-renew. Pricing is for analysis credits only — your lab PDF still comes from your provider.
Everything you need to actually understand your labs
Universal PDF parsing
RangeTrue reads lab reports from any major US or international lab. Quest, LabCorp, ARUP, hospital networks, concierge panels, and direct-to-consumer tests are all supported. Our parser handles multi-page reports, varied layouts, and non-standard biomarker names — normalizing everything to a canonical form for consistent scoring.
- Compatible with any standard lab PDF format
- Multi-page report support
- Automatic unit normalization (mg/dL ↔ mmol/L, etc.)
- Non-standard biomarker name resolution
Optimal range scoring — not lab normals
Every biomarker is evaluated against a curated optimal range database, not the population reference intervals printed on your lab report. Our ranges are drawn from functional medicine consensus, longevity and prevention research, and sports medicine literature. Each range is calibrated for age and sex where the evidence supports it.
- Curated from functional medicine and longevity research
- Age- and sex-adjusted ranges where evidence supports
- Covers 80+ standard biomarkers
- Continuously updated as new evidence emerges
Root-cause AI analysis
For every biomarker outside optimal range, our AI generates a structured analysis: the most likely physiological drivers behind that specific result, lifestyle and dietary factors known to affect it, what the research says about correcting it, and what questions to bring to your doctor. Everything is grounded in cited sources — not generic health advice.
- Ranked root-cause drivers for each flagged biomarker
- Lifestyle, dietary, and supplementation factors
- Evidence citations for every recommendation
- Tailored to your specific result, not generic tips
Composite score with category breakdown
Your overall composite score (300–1,000) gives you a single reference point for your current metabolic and physiological health. Below the composite, a category breakdown shows you how each system — metabolic, hormonal, cardiovascular, inflammatory, nutritional — contributes, so you know exactly where to focus attention.
- Composite score weighted by clinical significance
- Category breakdowns: metabolic, hormonal, cardiovascular, inflammatory, nutritional
- Score labels: Excellent through Action recommended
- Changes over time as you upload follow-up reports
Biomarker-level detail
For every extracted biomarker you get: your raw value with unit, the lab's reference range, the optimal range RangeTrue uses, your individual biomarker score, and the status classification (optimal, suboptimal, outside standard). Everything is displayed in a sortable table with category grouping so you can review your results systematically.
- Raw value, lab range, and optimal range side by side
- Individual score per biomarker
- Sortable and filterable biomarker table
- Grouped by category: metabolic, hormonal, etc.
Secure, private, and yours to control
Your lab report contains some of the most sensitive health data that exists. We treat it accordingly. Files are encrypted in transit and at rest. Your data is never sold, never used for advertising, and never shared with third parties. You can delete your reports and all associated data permanently at any time.
- AES-256 encryption at rest, TLS in transit
- No sale of data to advertisers or data brokers
- On-demand permanent deletion
- SOC 2 Type II infrastructure
80+ biomarkers scored against optimal ranges
If it's on your standard lab panel, we score it. Here's what's covered — and we're adding more as our optimal-range database grows.
- Glucose
- HbA1c
- Insulin (fasting)
- HOMA-IR
- BUN
- Creatinine
- eGFR
- ALT
- AST
- GGT
- Albumin
- Total protein
- Total cholesterol
- LDL
- HDL
- Triglycerides
- ApoB
- Lp(a)
- hsCRP
- Homocysteine
- Fibrinogen
- TSH
- Free T4
- Free T3
- Reverse T3
- Anti-TPO
- Anti-thyroglobulin
- Total testosterone
- Free testosterone
- SHBG
- Estradiol
- Progesterone
- DHEA-S
- LH
- FSH
- Prolactin
- Vitamin D (25-OH)
- Vitamin B12
- Folate
- Ferritin
- Iron
- TIBC
- Magnesium (RBC)
- Zinc
- Selenium
- Omega-3 index
- WBC
- RBC
- Hemoglobin
- Hematocrit
- MCV
- MCH
- MCHC
- Platelets
- Neutrophils
- Lymphocytes
- Monocytes
- hsCRP
- IL-6
- TNF-alpha
- Fibrinogen
- ESR
- Uric acid
- Cortisol (AM)
- DHEA-S
- Pregnenolone
- Aldosterone
Built for people who take their health seriously
You already get regular labs. You know "normal" is a low bar. RangeTrue gives you the functional medicine lens on your results — without the $500/hr consultation to get it.
- Compare your results against optimal, not just population norms
- Identify the specific biomarkers holding your score back
- Track progress as you implement dietary or lifestyle changes
- Share your full scored report with your practitioner
Training load affects your labs in predictable ways. Suboptimal ferritin tanks your VO2 max. Chronically low testosterone blunts recovery. Suboptimal thyroid function limits power output. Know where you stand.
- Iron, ferritin, and CBC optimization for endurance
- Hormonal panel scoring for recovery and adaptation
- Inflammatory markers to gauge training load
- Nutritional status for performance maintenance
Standard care shows you whether you're sick or not. RangeTrue shows you how far you are from truly well — and gives you specific, evidence-based talking points for your next appointment.
- Understand your results before your doctor's appointment
- Identify which suboptimal results are worth discussing
- Evidence-based root-cause analysis to bring to your provider
- Track changes report-by-report over time
Your lab report is personal. We treat it that way.
Your lab report PDF and all extracted data are encrypted with AES-256 at rest and transmitted over TLS 1.3. We use SOC 2 Type II certified cloud infrastructure.
Your health data is never shared with third-party advertisers, data brokers, or analytics platforms. We do not monetize your data in any form.
Delete any report — or your entire account — at any time. Deletion is permanent and complete within 30 days, including all backups.
Your PDF is never stored unencrypted. AI analysis calls use transient processing — your data is not retained by our AI providers after the call completes.
Common questions
No. RangeTrue is an informational tool that helps you understand your lab results more deeply. All guidance is clearly labeled as informational and not medical advice. We strongly encourage you to discuss any results and next steps with your healthcare provider.
Any standard lab report PDF — Quest Diagnostics, LabCorp, ARUP, hospital systems, concierge labs, and most direct-to-consumer panels. If your lab prints a PDF, we can parse it. Reports in languages other than English are not currently supported.
Our optimal ranges are drawn from published functional medicine literature, longevity research, and preventive medicine studies — not from lab population reference intervals. Where evidence supports age- or sex-adjusted targets, we use them. Our database is reviewed and updated by our medical advisory team quarterly.
RangeTrue extracts your actual values from your PDF, scores them systematically against calibrated optimal ranges, generates a composite score, and produces a root-cause analysis specific to your result — not a generic article about what a biomarker does. The difference is the depth, the specificity, and the systematic coverage of every marker on your report simultaneously.
Most reports finish in about 3–5 minutes. Extraction and scoring are usually quick; personalized guidance for each flagged biomarker takes the longest. You'll see live stage updates while processing runs.
Yes. Every completed report has a shareable link that gives view-only access to your scored results and guidance. The recipient does not need a RangeTrue account.
Your first report is free — no credit card required. After that, buy report credits in Starter, Plus, or Pro packs. Credits never expire and every paid report includes the full score, biomarker table, and root-cause guidance.
We cover 80+ standard biomarkers across metabolic, lipid and cardiovascular, thyroid, sex hormones, nutritional, complete blood count, inflammatory, and adrenal panels. If a biomarker on your report isn't in our database yet, it will appear as extracted but unscored — we add new markers regularly.
Ready to see what your labs actually say?
Your first report is free. Get your composite score, every biomarker against optimal ranges, and root-cause guidance — then add credits only when you need another analysis.
Works with Quest, LabCorp, hospital labs, and more.